
The magnitude 4.0 earthquake on 28 May 2023 at 11:41pm, whose epicentre was located near the outer northern Melbourne suburb of Craigieburn, was recorded on dozens of seismometers and accelerometers across the state, providing a plethora of data for seismologists to analyse how ground motion changes over distance.

The nearest seismic monitoring station at Greenvale was only 4km from the epicentre – a station operated by Geoscience Australia but originally established at that location by the SRC, with records going back to 1976. Live data from GA stations is streamed at 40 samples-per-second (sps), but is locally recorded at higher resolution at 200sps.
The displayed social media post by SRC’s Chief Scientist Adam Pascale shows how a difference in sample rate can result in a peak ground motion value that could be underestimated by a factor of almost x2.
Data from GVL station 4km from epicentre of ML 4.0
— Adam Pascale (@SeisLOLogist) May 30, 2023
200sps data shows peak frequency at 28Hz, PGV at 15.6 mm/s, and PGA at 0.21g
40sps data from the same station cuts off frequency & reduces PGV to 8.0mm/s
⚠️Low sample rate data can lead to underestimated magnitudes/peak motion⚠️ pic.twitter.com/jjkLCF1iGw

Recordings from our Headquarters
At the SRC’s office in Richmond, about 30km from the epicentre, we had a number of test instruments recording data continuously at the time of the earthquake, including two triaxial accelerometers (a low cost MEMS-type, and a low noise IEPE-type) as well as a GaiaCode Alpha Light 120-second broadband seismometer that was being tested before delivery to a government research organisation.
The low cost MEMS accelerometer was located on the concrete ground floor near the seismometer, whereas the low noise IEPE accelerometer was one floor above sitting on a table. The following waveforms show the comparative recordings of the vertical channels of these accelerometers as the upper floor sensor’s horizontal motion was artificially amplified by the table.
100Hz sampling ≠ 100Hz data
The first image below shows the magnitude 4.0 earthquake recording on the two accelerometers. The low cost MEMS accelerometer was being sampled at 100sps, with the lower noise IEPE accelerometer sampled at 250sps.
You would think that a system that samples data 100 times per second would be able to show you ground motion data up to 100Hz, but Nyqvist theory and digital sampling filters means that only signals up to about 40% of the sampling frequency are visible in the resulting data.
The white dotted line in the spectrograms below is drawn at 40Hz, so you can see that there is very little signal energy recorded above this level on the 100sps accelerogram, but the earthquake did contain higher frequency energy, as seen on the 250sps record. That high frequency energy produced a peak ground acceleration (PGA) about 2x higher than seen on the 100sps record. The fainter dotted line on the upper record shows 100Hz, which is 40% of 250sps. If we were sampling at 500sps we may have seen even higher frequency energy and PGA values, but sampling faster also increases signal noise levels.

Sensor and Digitiser Noise
As we’ve discussed before, digital data loggers and seismic sensors are limited in recording range, so finding the balance between data volume, sampling noise, sensor cost, and sensor noise is not easy. The image below shows the magnitude 2.8 aftershock that occurred 9 minutes after the magnitude 4.0 above. This aftershock is around 20 times smaller than the main shock, so the background noise before the earthquake is relatively prominent.
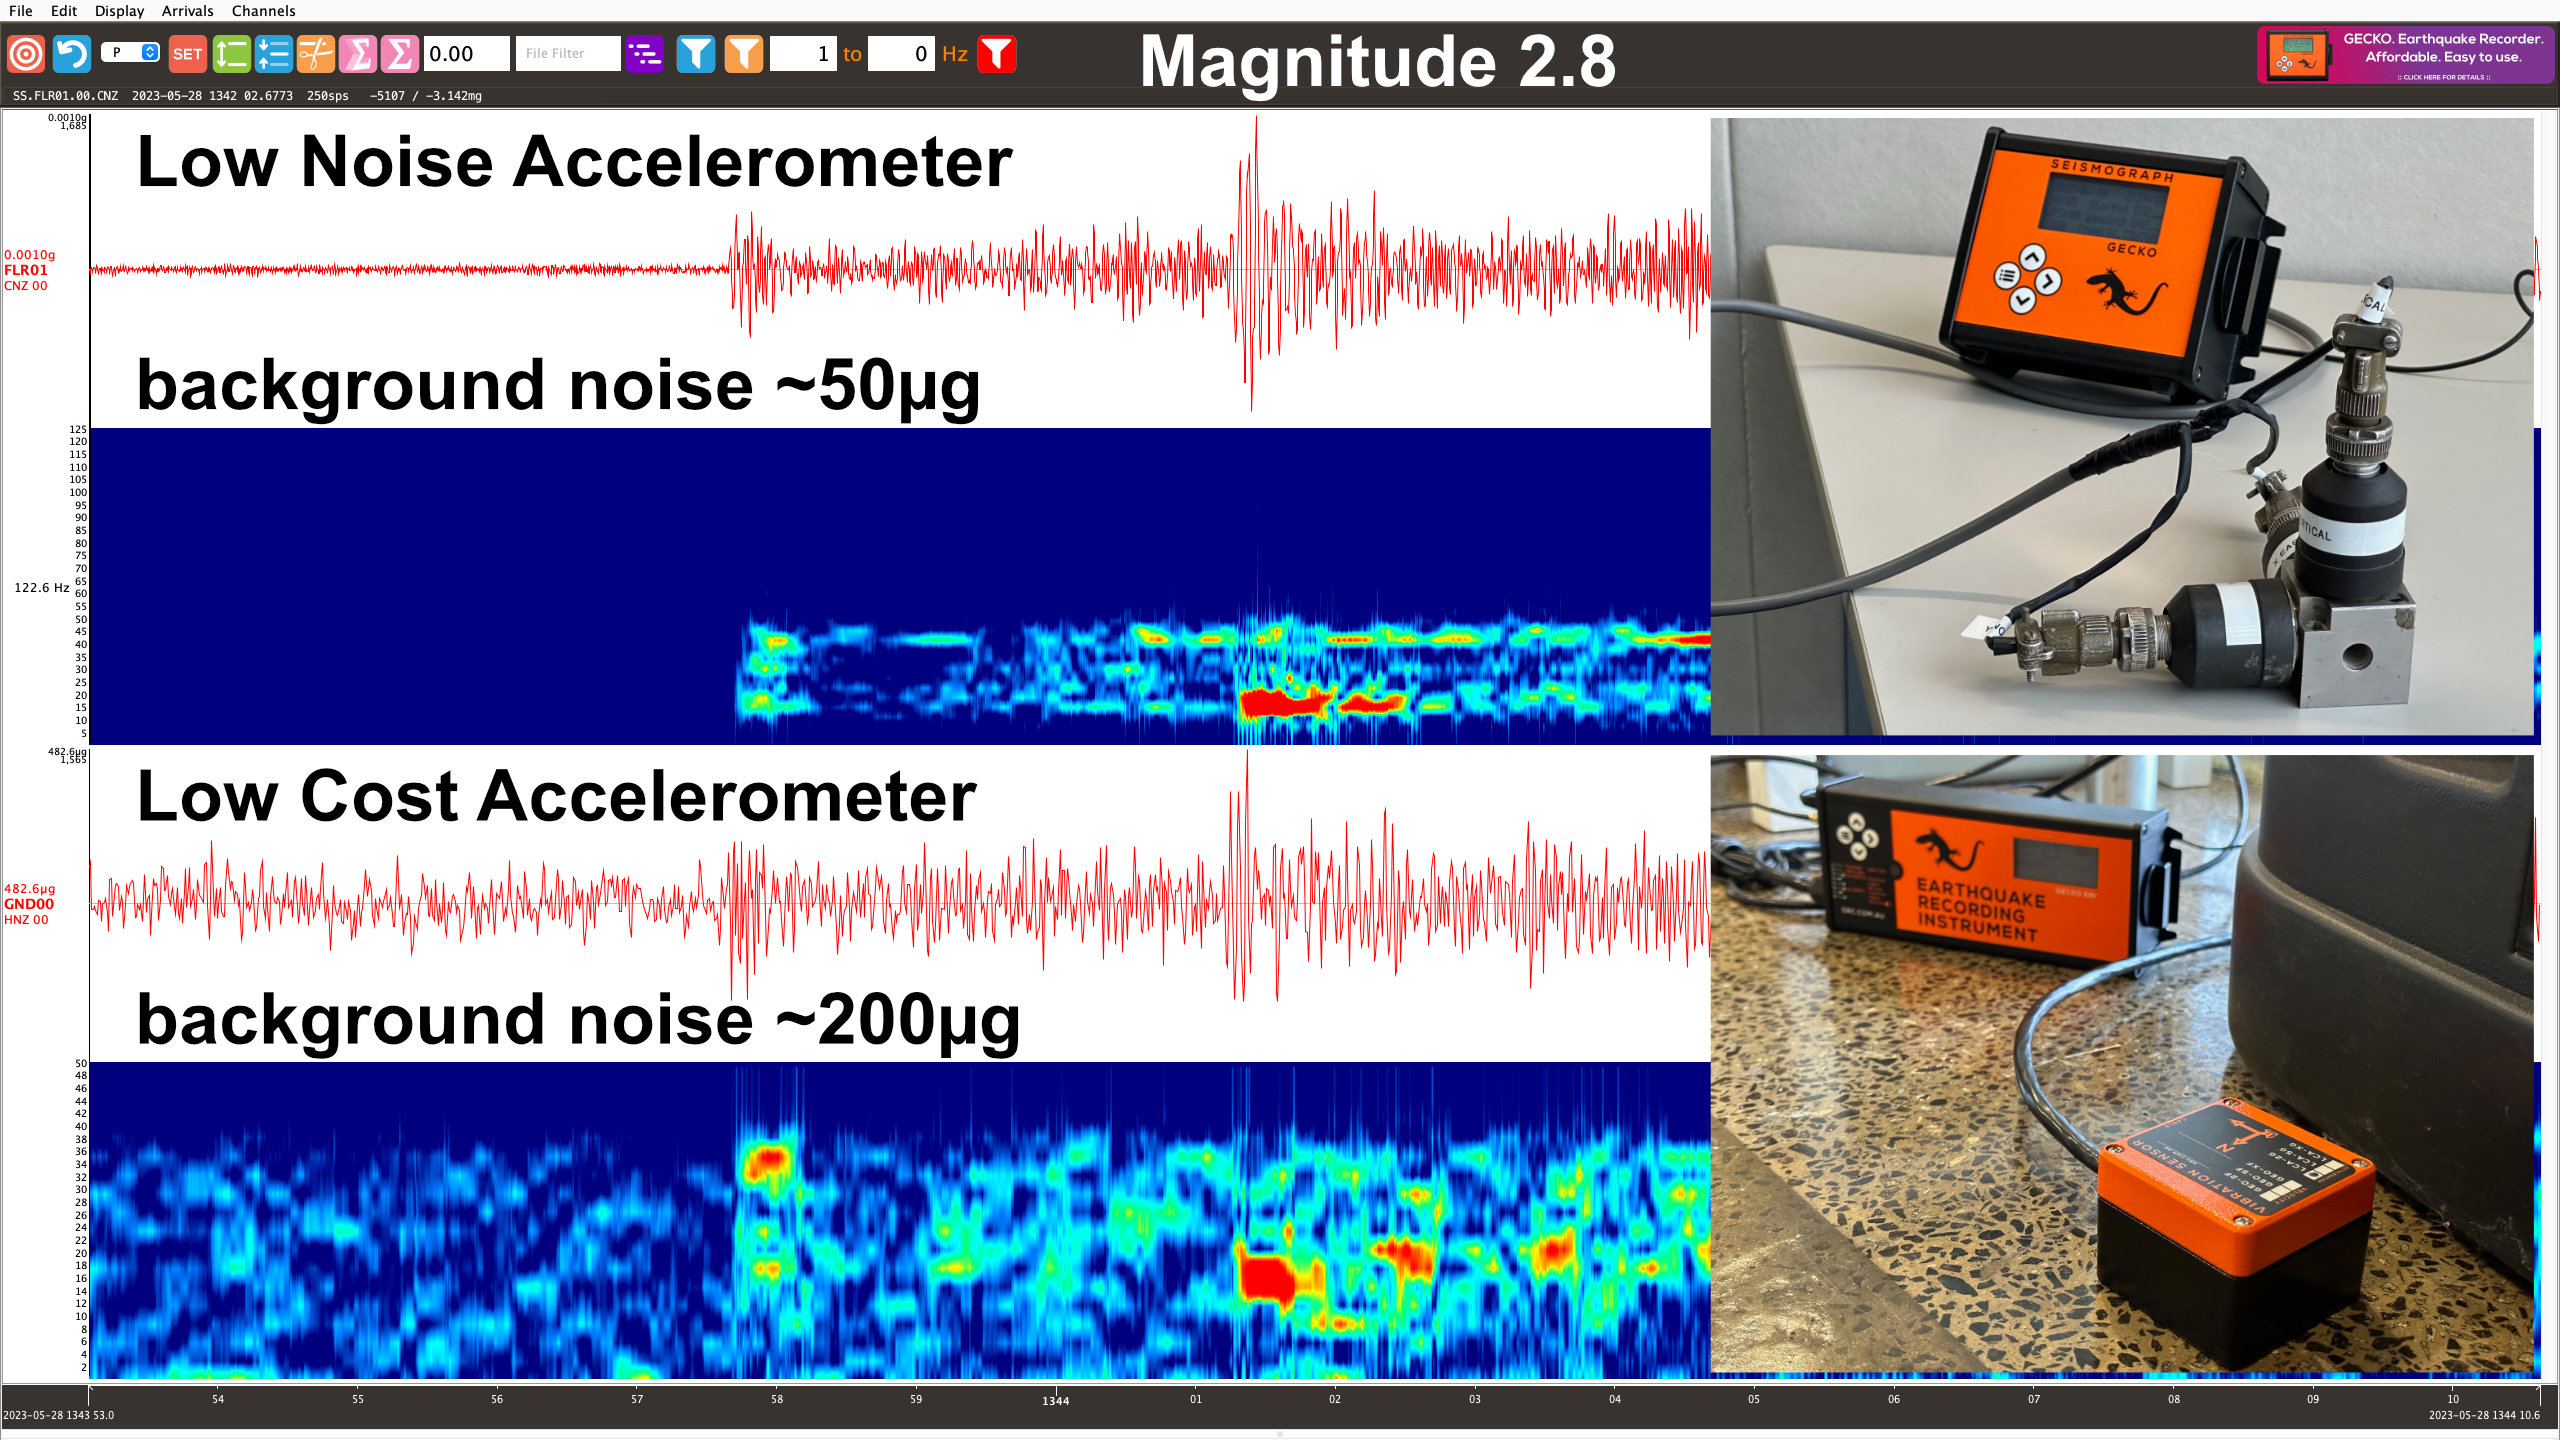
The aftershock is certainly visible on the low cost accelerometer, but due to that sensor’s higher self-noise level of around 200µg, the event is very hard to see if the waveform was viewed alone. Viewing the spectrogram helps earthquake frequencies stand out from environmental noise frequencies.
The low noise accelerometer (below, top) is still recording around 50µg of noise, but this is urban environmental noise levels, not sensor self-noise. In the right location this sensor can reveal signals down to 2µg (2-millionths of the acceleration due to gravity).
For information about digital data loggers and sensors see the SRC data sheets here or contact us.