The SRC is now streaming live earthquake data to our YouTube channel. The selection of stations covers southeast Australia, so if you’re in the region and there’s been something large enough to feel, you should be able to see it on some nearby stations.
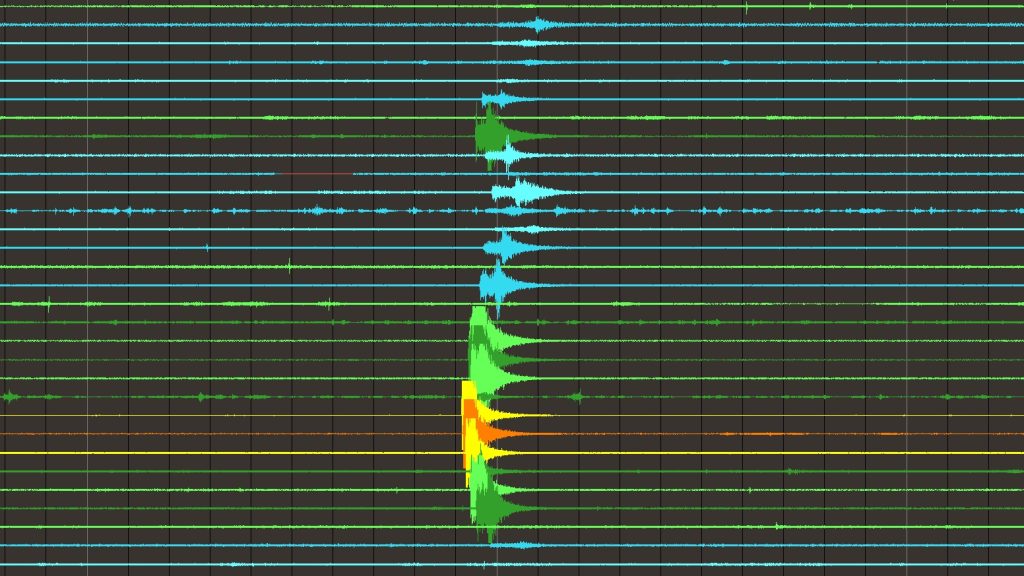
Each line shows the last hour of ground motion at a particular seismic station, with the latest data on the right edge of the image. Note that time is displayed in UTC (Universal Time, Coordinated) which is 10 hours behind AEST, so if you see that the time stamp of 0335 that means 1:35pm AEST.
Click on this map to see the location of each station code that is displayed on the right of the image.
The colour of the line indicates the peak level of ground motion in the last hour. The colours correspond to the following peak ground velocity:
🔵<1µm/s
🟢1-25µm/s
🟡25-50µm/s
🟠50-200µm/s
🔴200µm/s+

We don’t typically get reports of people feeling motion that is below the “yellow” level, and even then only for people very near that station. A red signal does not necessarily mean it is a damaging event – it just means that a nearby seismic station experienced it strongly, but that could happen if a station is right on top of a shallow magnitude 2.0 earthquake.
What about Western Australia and other parts of the country? Our observatory is funded by the private sector, so we install and analyse data from seismic stations in areas where these stakeholders operate. If we don’t have stations in a particular area, it means that we are not funded to operate in the region, or that data is not in the public domain. The network changes from year to year, and we are always open to expanding our network to provide earthquake notifications for emergency management services.