
The world’s best earthquake waveform viewer keeps getting better! Waves can read MiniSEED, PC-SUDS, SAC, and many other data formats, and can locate earthquakes using 1D velocity models. Download for free using the links below for Windows, macOS and Ubuntu, and be sure to read the user manual!


Want to try out Waves with some sample data? Here’s a small earthquake that occurred in Melbourne’s north in July 2021 as recorded by weak motion seismographs scattered around nearby suburbs. Pick the P and S phase arrivals to determine the location and magnitude.
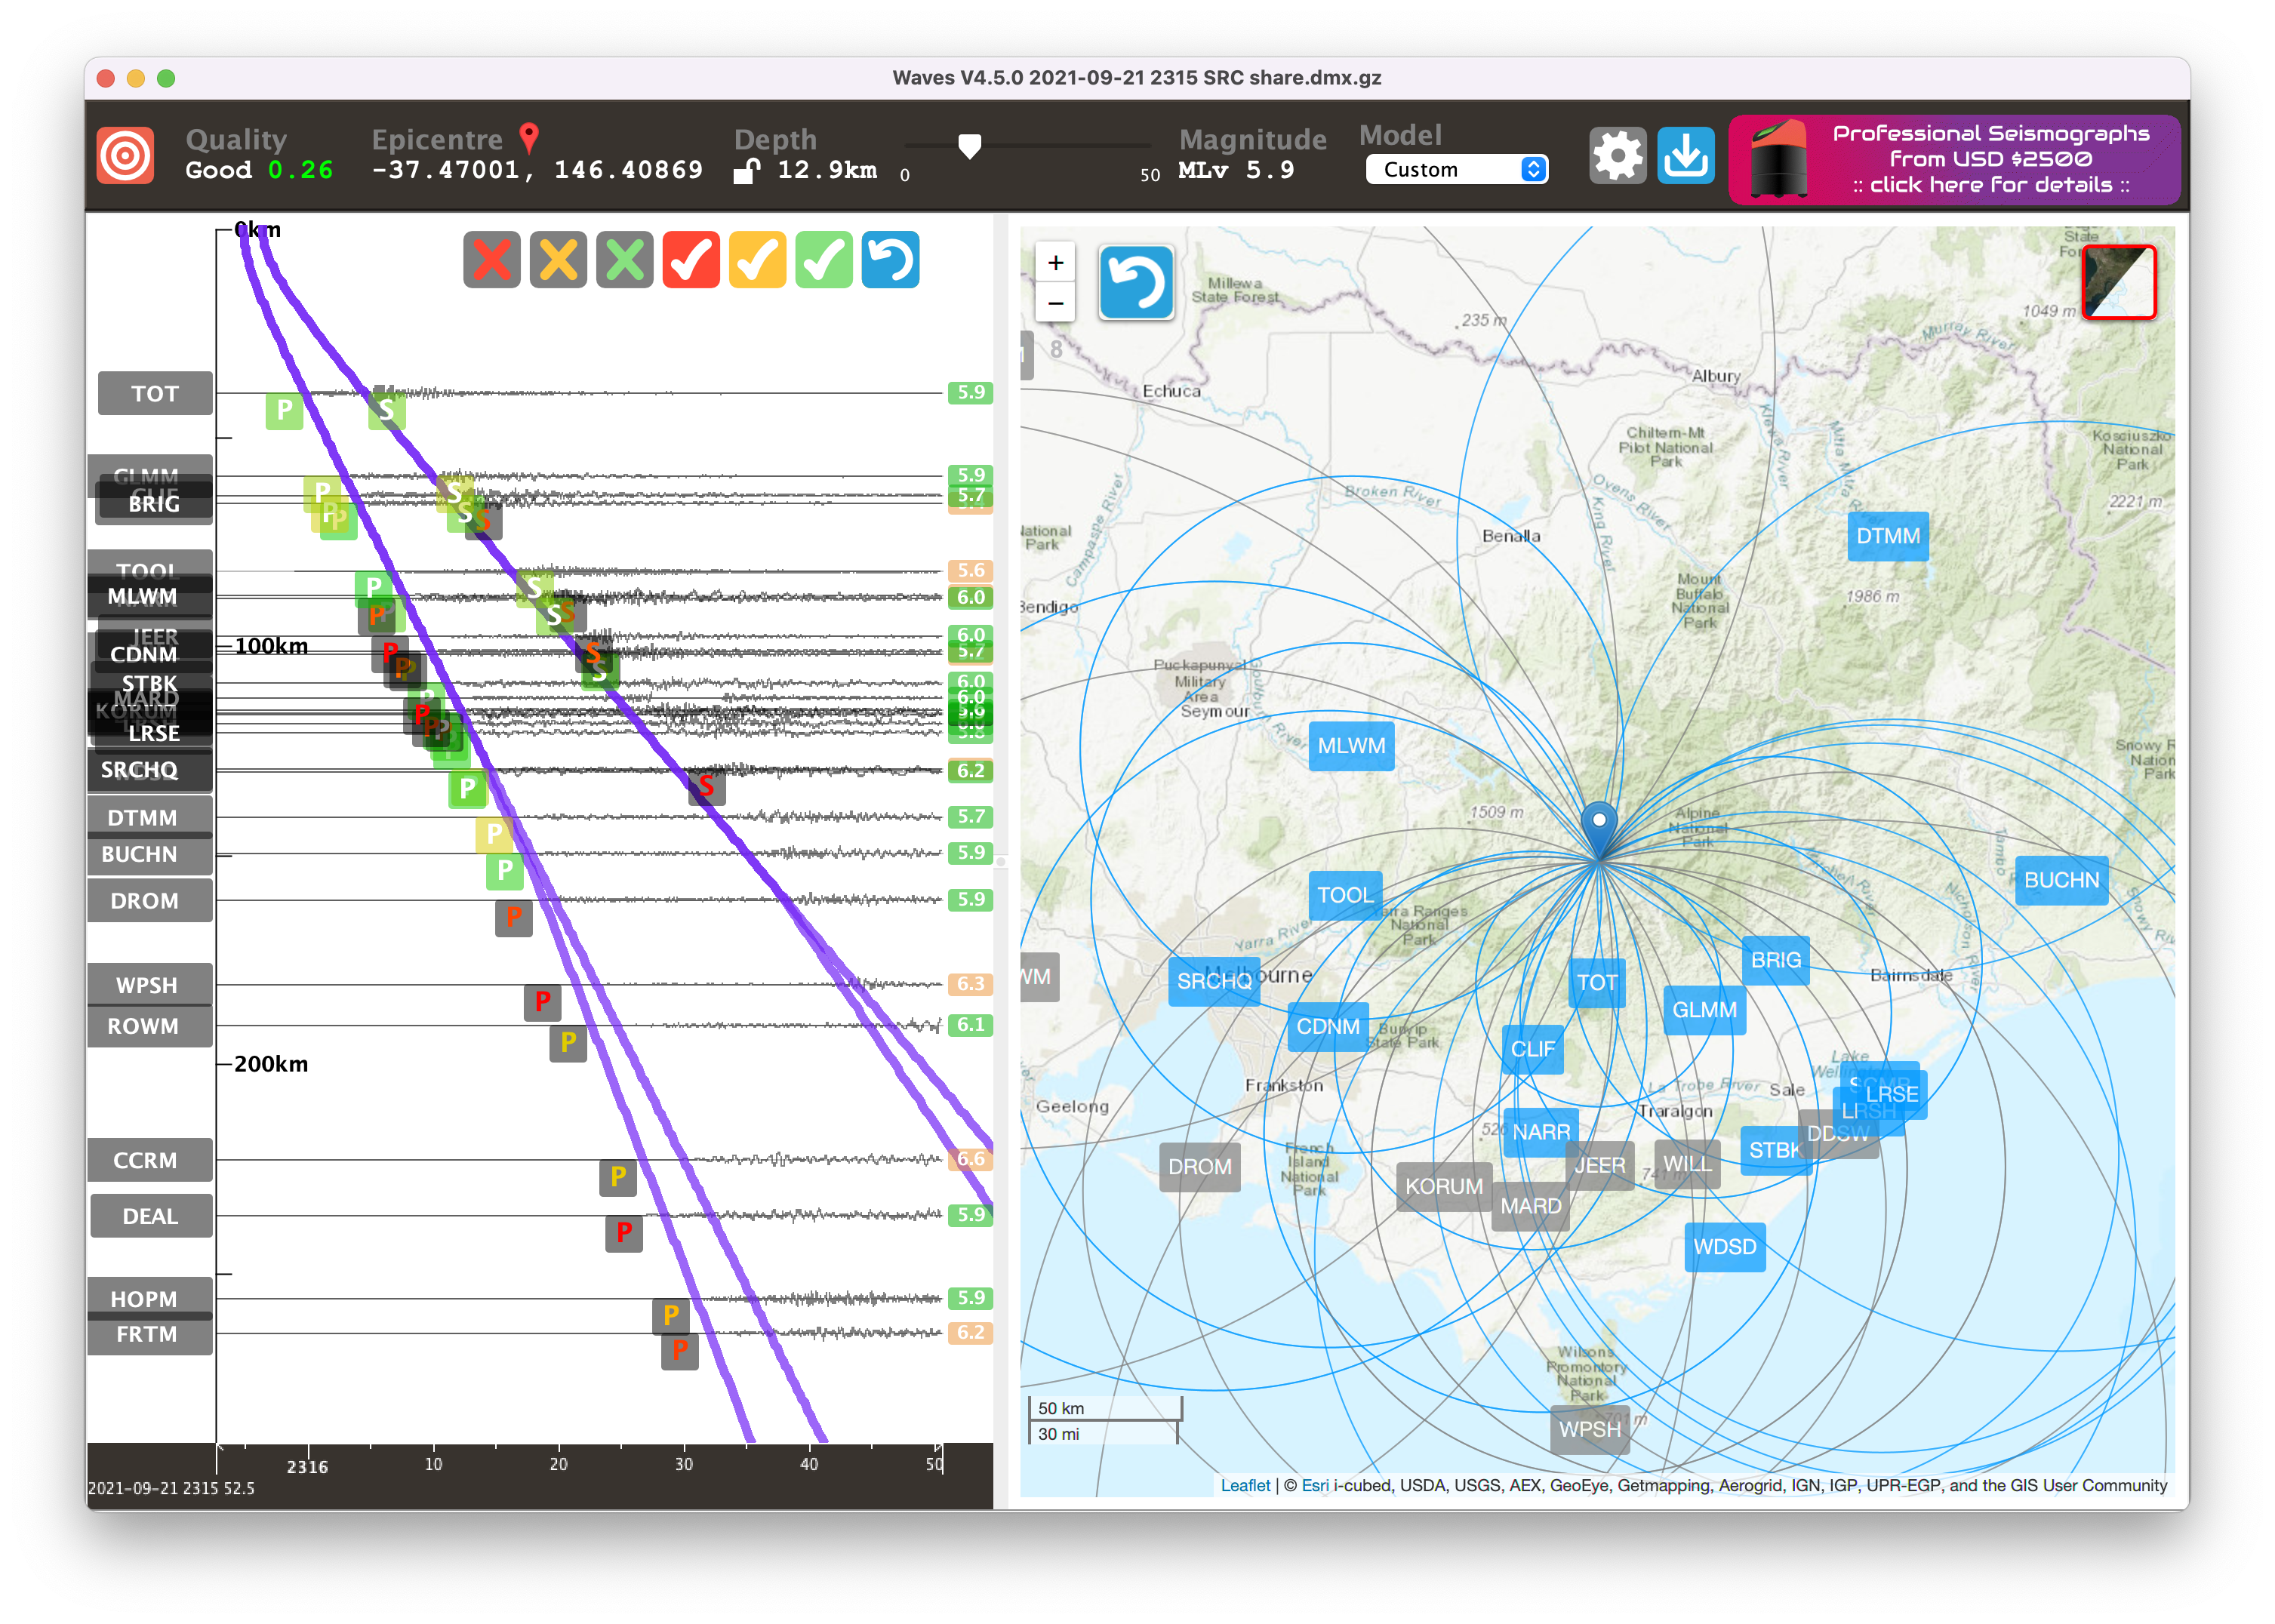
You can also try out this magnitude 6.3 earthquake recorded on six Gecko strong motion accelerographs ranging from 40km to 110km from the hypocentre.
Waves 4.8 brings minor new features and some bug fixes:
- Edit the station code in the new station info panel
- Fixed bug with waveform-only magnitude estimation
- Fixed bug where edits to channel Sensitivity were not being applied or saved every time
- More decimal places displayed for original PC-SUDS volts-per-unit info
- Now compiled for Macs with M-series Apple Silicon processors as well as older Macs with Intel processors
Waves 4.7 included new keyboard shortcuts and more! Here’s an overview of what’s changed:
- Support for HiDPI displays for all on-screen text and waveforms
- New station info replaces channel info, allowing all channels to be viewed and edited at once
- Sensitivity is the main scaling parameter that can be edited, which is derived from the PC-SUDS/SS-file’s Counts/V, V/Unit & Gain, which are retained but not editable
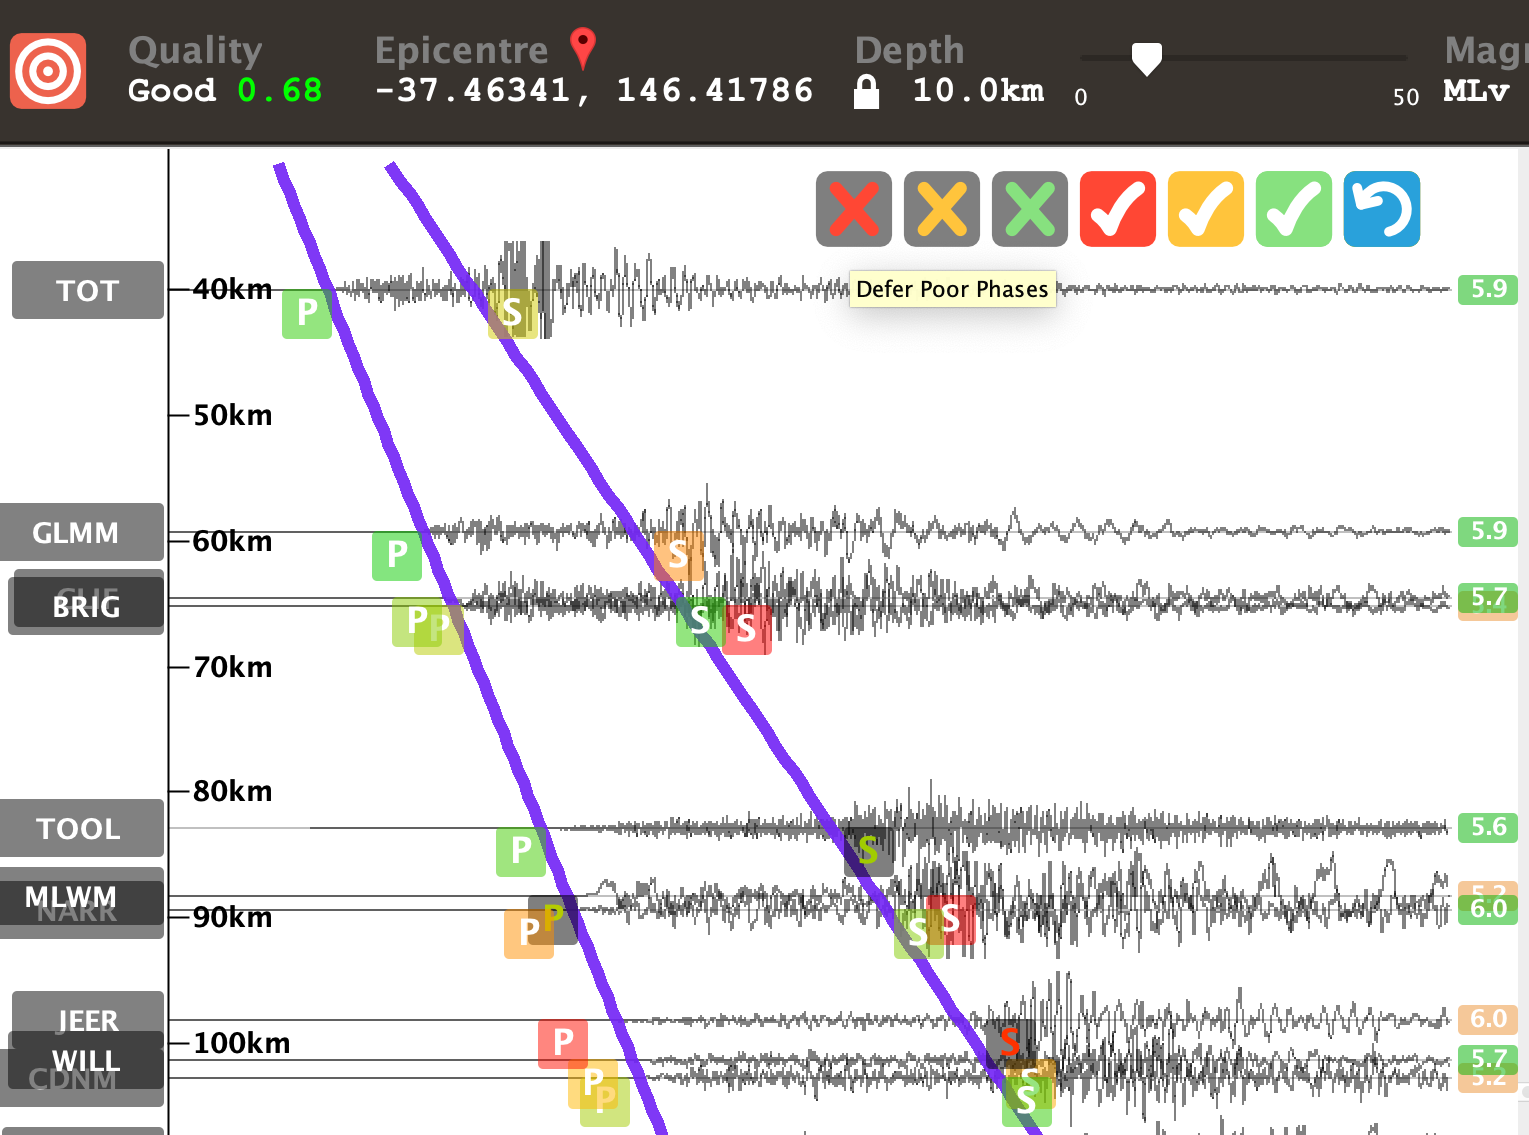
- New defer bad magnitude and include good magnitude buttons
- Revised “defer bad arrival” buttons with improved legibility
- Reads Gecko 7.8 format histogram files to graph PGA, PGV, PGD values
- Shows estimate of magnitude on waveform traces until user starts a location, then mag/dist estimates disappear to avoid comparisons with modelled solution
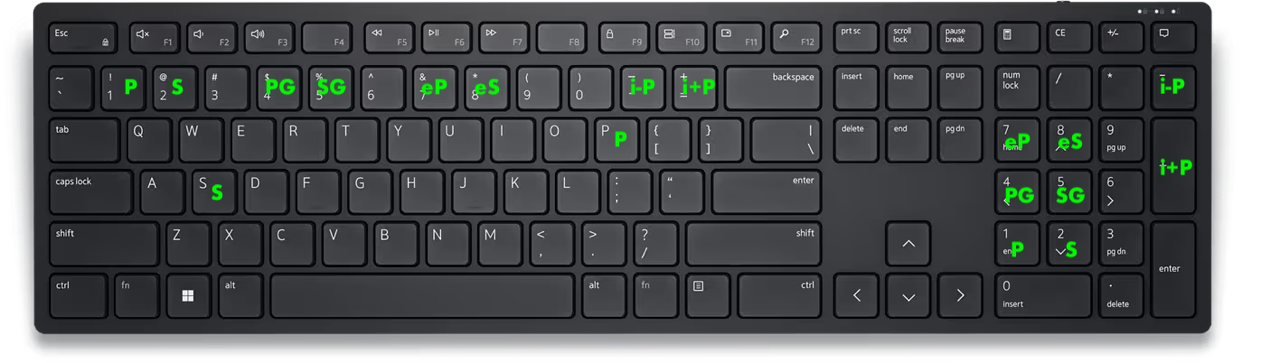
- New keyboard/keypad shortcuts for arrival picking, including i+P and i-P to prepare for the future focal mechanism feature
Waves 4.6 fixed a bug related to displaying only the vertical channels, and added a keyboard shortcut of Command-1 to perform this function.
Waves 4.5 added a TAB key shortcut to jump between stations (alphabetically) when analysing waveforms; shift-TAB to go back, Command-A to show all. The stations on the event location map are now colour-coded: blue stations are being used in the solution, and grey station have waveforms available but have no phase picks being used in the solution.
Waves 4.4 added support for Histogram files generated by Gecko 7.3 seismographs. It also added epicentral distance to the magnitude formula, and now shows rough distance on waveforms using S-minus-P time x8.
Waves 4.3 added defer/include phase tools to make refining the earthquake solution faster. It also highlights outlier magnitudes, and we improved the import of SAC format files.
Waves 4.2 refined the location feature by giving you more control over mapping and station response data sources. It also introduced uploading of solutions to an eqServer database and saving the solution to a text file with added earthquake information. The 4.2.1 update fixed a bug in the PDF report for displacement plots, and trims files saved to as SEG-2 to the first whole second.
Waves 4.1 introduced PDF report generation for blast and vibration monitoring applications, summarising 3D (ground motion) and 1D (microphone air pressure) data sets in time series, FFT frequency plots, and USBM RI8507 style amplitude/frequency zero-crossing plots. This update also improved the STA/LTA ratio simulation to help fine tune Gecko recorder triggering.
Waves 4.0 finally brought multi-layer velocity model location algorithms from eqFocus into an interactive graphically interface that’s easy to use, and just as easy for students to understand when used as a teaching tool. It includes map-visualised solutions and a simple pointer-based controls to make data analysis fast and efficient. Watch the introductory video here.
Waves 3.6 introduced a great new feature – automatic IRIS DMC lookup and integration of station.xml data, stored locally on your computer for future use! New features include the ability to flip a channel’s polarity, and the high pass frequency for displacement calculation can be customised for magnitude calculation. Waves now also reads SEG-2 format, and we have refined the zoom and scroll controls and added more keyboard shortcuts for a more intuitive user experience.
Waves 3.5 added right-click-scrolling to zoom, thumb/tilt wheel timeline scrolling, and some minor bug fixes to the new Trim feature, frequency and magnitude estimate displays.
Waves 3.4 brought additional controls to the toolbar, spectrogram, and to your pointer. We also re-designed the setttings menu using tabs to make their functions and presentation clearer.
The toolbar now has buttons to control Amplitude and Zero Correction display, a button to activate a Trim function to clip the recording to only the visible data channels and time span, a button to display the 3D vector sum of a triaxial group, and a button for a 2D vector sum of the horizontal channels.
New design Filter buttons were used in the toolbar, channel panes, and in the frequency window. We introduced graphical buttons on the spectrogram for linear and log display, controls to adjust the frequency sample window size, and controls to adjust the intensity of the frequency.

New controls included the ability to zoom the time series waveform using the scroll wheel of your mouse, or hold Control to scroll vertically, or flip these controls in the Settings. Note that zooming with some touch control devices (e.g. macOS trackpads) is not supported. You can now double-right-click your mouse to reset the time line zoom, and you can adjust the speed of the zooming and time line scrolling in the Settings.
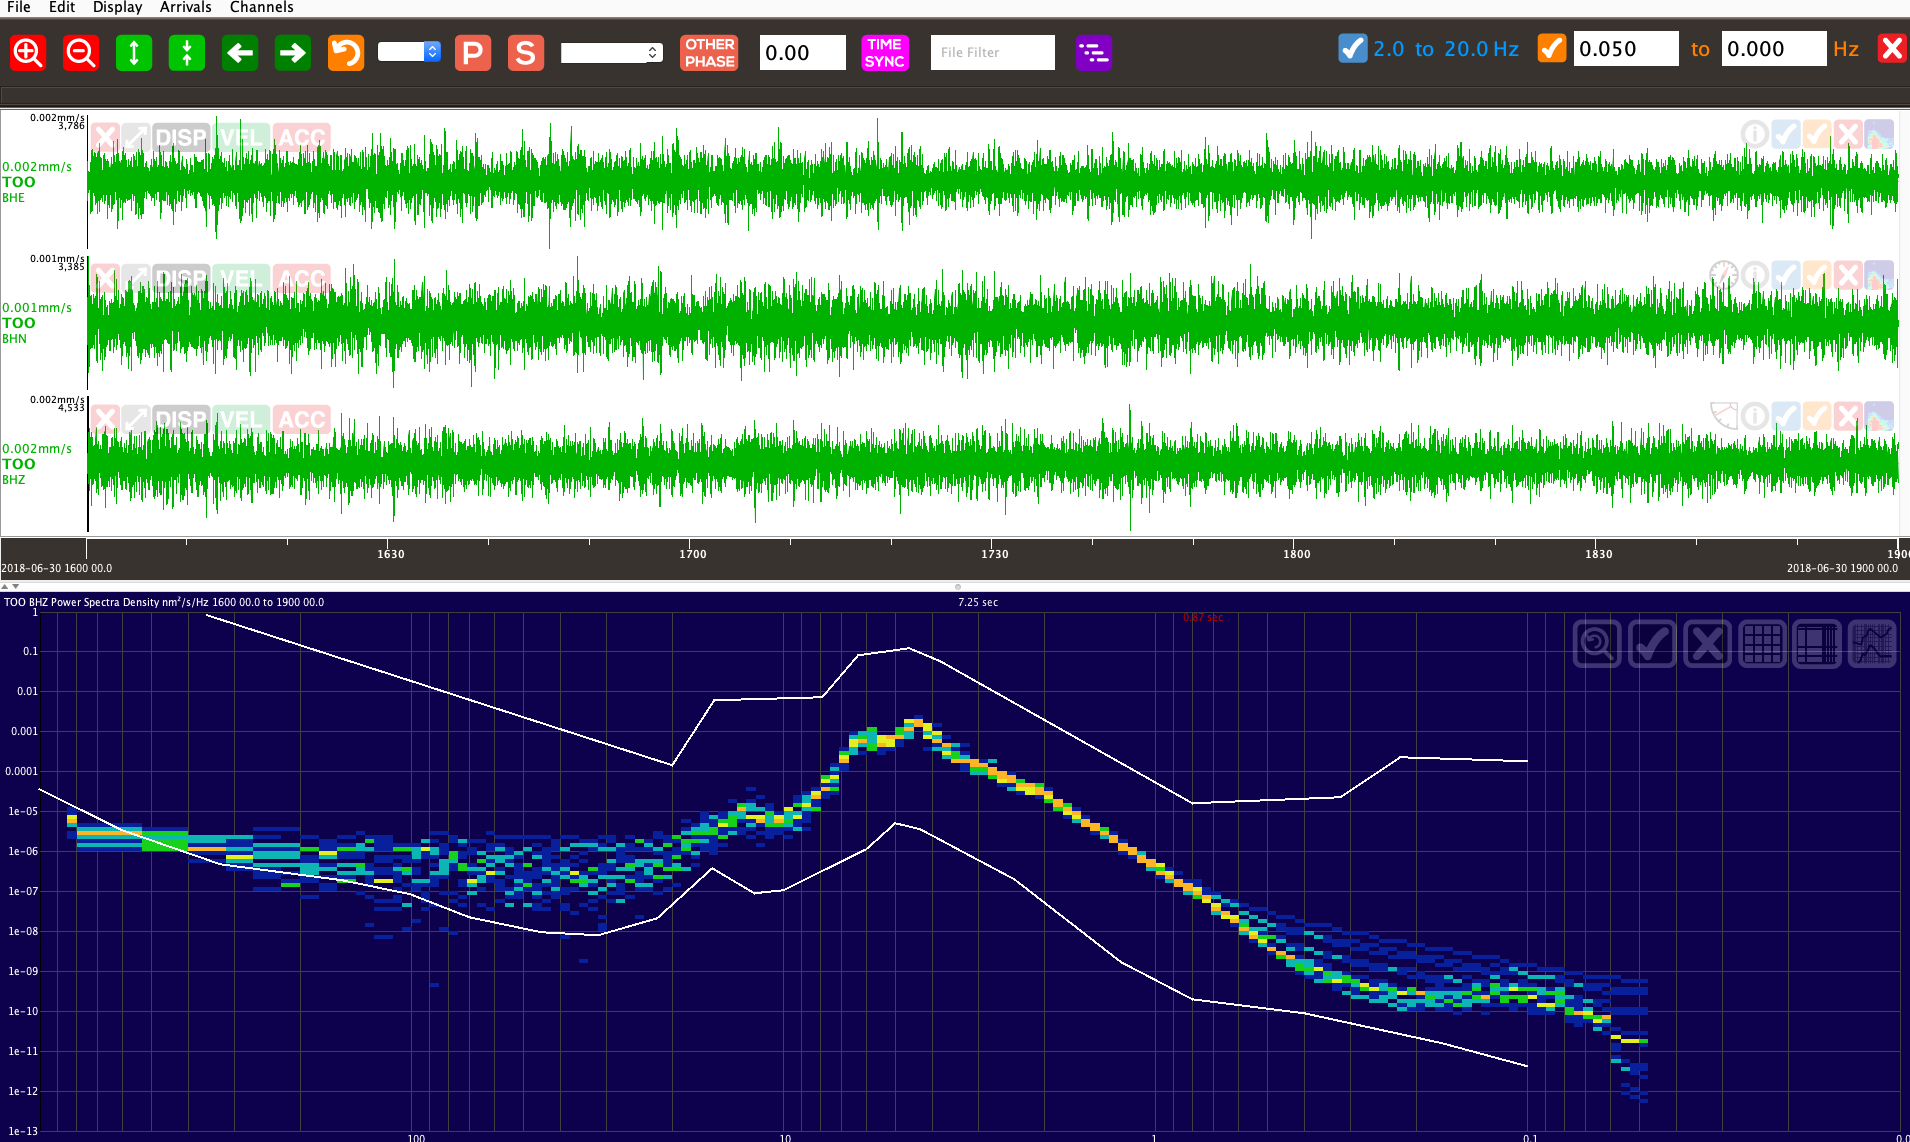
Waves 3.3 saw the return of the log scale FFT relative power plot to the frequency domain window, which can be toggled to a Power Spectral Density (PSD) plot. Another mode allows you to overlay the PSD onto the Peterson NLNM and NHNM curves. Buttons in the frequency window allow you to reset the frequency scale zoom, filter to the selection, filter out the selection, clear the filter, and swap between linear, log and NxNM views. More poles and zeroes fields were added to better scale the PSD plot, and these factors are saved to SUDS format files.
Version 3.0 of Waves introduced the ability to rotate your waveforms, both horizontally and in elevation. It also allows the customisation of the magnitude estimation formula. Other features include the ability to select and zoom in the FFT window to filter your data, either through selection or exclusion by notching out frequency bands.
The free version of Waves is supported by a 10-second advertisement that is updated from an external server from time to time. A product key is available for A$110 per computer that allows immediate access to Waves. Contact us if you would like to purchase product keys. A product key is available at no cost if you have purchased a Gecko seismograph or accelerograph. Limited to one single-use code per Gecko.